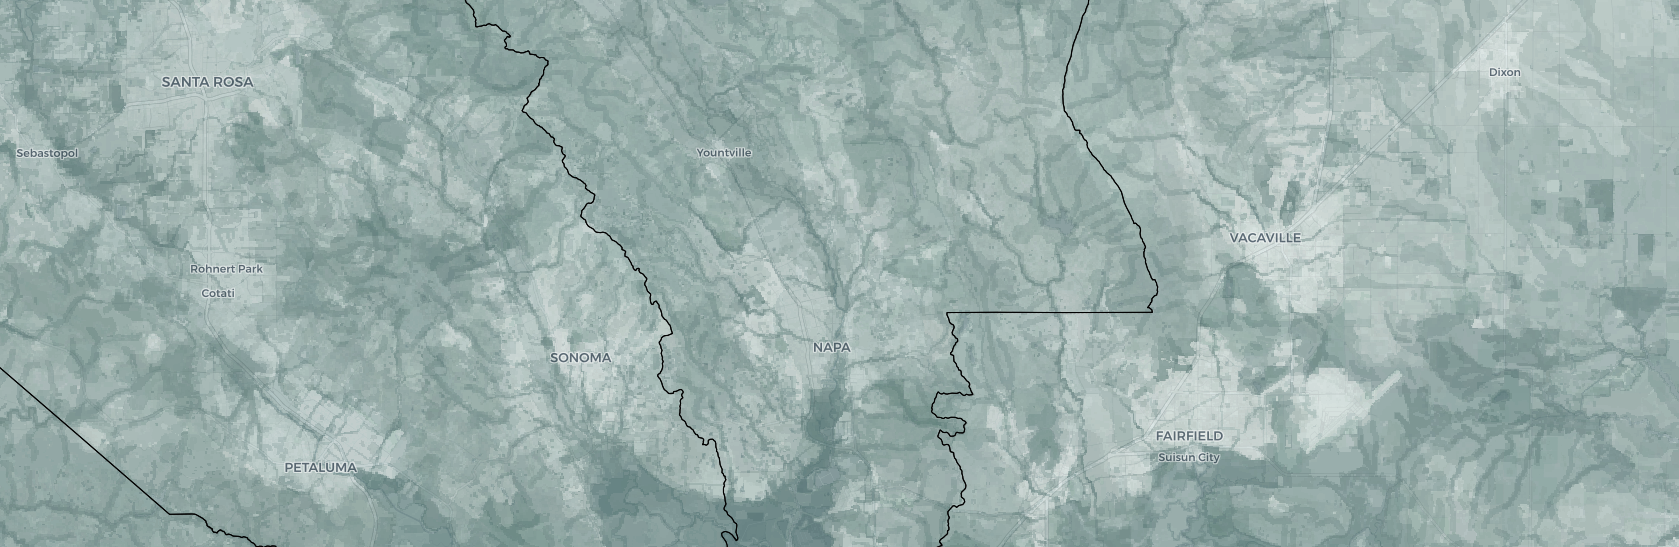
Bay Area Greenprint application
The Nature Conservancy in California
GreenInfo team: Dan Rademacher, Gregor Allensworth, Jayita Bhojwani, Tim Sinnott
Project years: 2016-2022
Tags: Conservation Economic Development Environment GIS Services Recreation Social Justice/Equity Strategy Web Mapping Website Design
Overview
What challenges is this project trying to solve?
- The value of environmental systems are often missed in public decision making regarding land uses. It becomes difficult for decision makers to account for them when information and data are dispersed across the web.
- The Bay Area is abundant with environmental and ecological diversity meaning that decisions created to match one geographic area may not apply to another.
What were the client’s objectives?
- Explore options and strategies with stronger consideration for conservation in land use decisions across the Bay Area
- Create interactive tools for communicating scientific data to both our regional partners and the general public in an accessible format
Results
- Access to a series of tools that support decision-making with an environmental lens through data visualization, strategic analysis, and impact reporting.
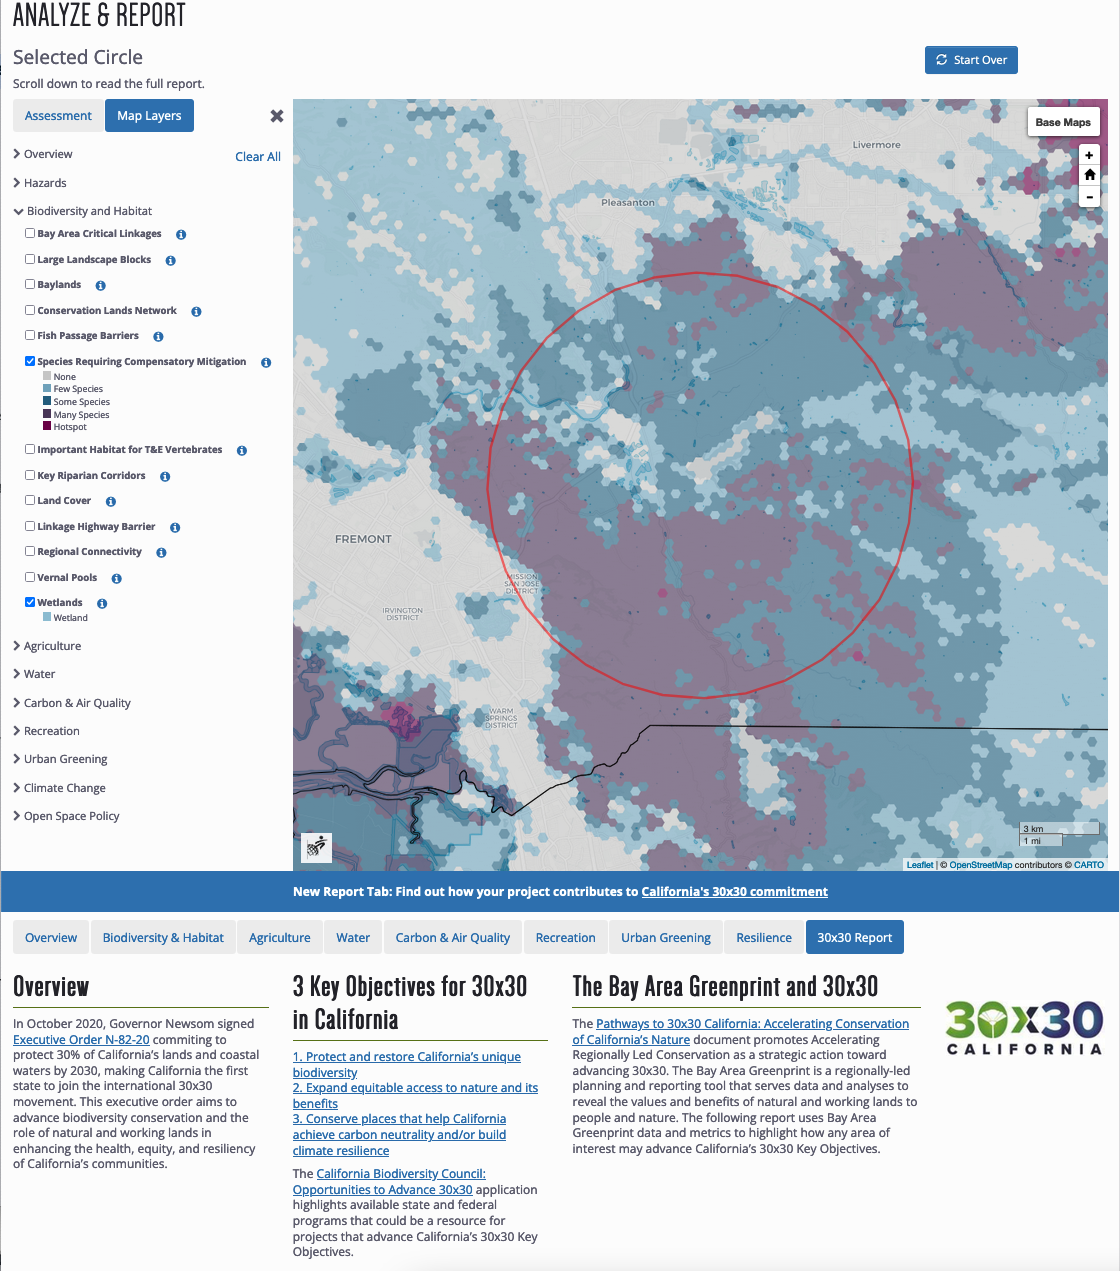
- The ability for users to generate reports based across a variety of environmental factors within a user-defined area.
The Work
Design Approach
The Nature Conservancy (TNC) has long championed the importance of these “nature’s benefits” or ecosystem services and, with other leading Bay Area nonprofits, has worked with GreenInfo to design, build, maintain, and expand a major web application to turn science and policy thinking into an accessible tool for public agencies, advocates, and anyone interested in the environmental implications of public decisions.
Translating the Data