
Analyzing tree canopy in schoolyards
Green Schoolyards America
GreenInfo team: Amanda Kochanek, Gregor Allensworth, Tim Sinnott
Project years: 2022-2024
Tags: Analysis Environment GIS Services Government Agencies Interactive Solutions Public Health Social Justice/Equity
Overview
What challenges is this project trying to solve?
- Asphalt school grounds are a common sight across schools, but they can be improved to promote and improve the quality of learning for children.
What were the client’s objectives?
- Transforming schools into green spaces improve children’s well-being, learning, and play while contributing to their communities' ecological health and climate resilience.
Results
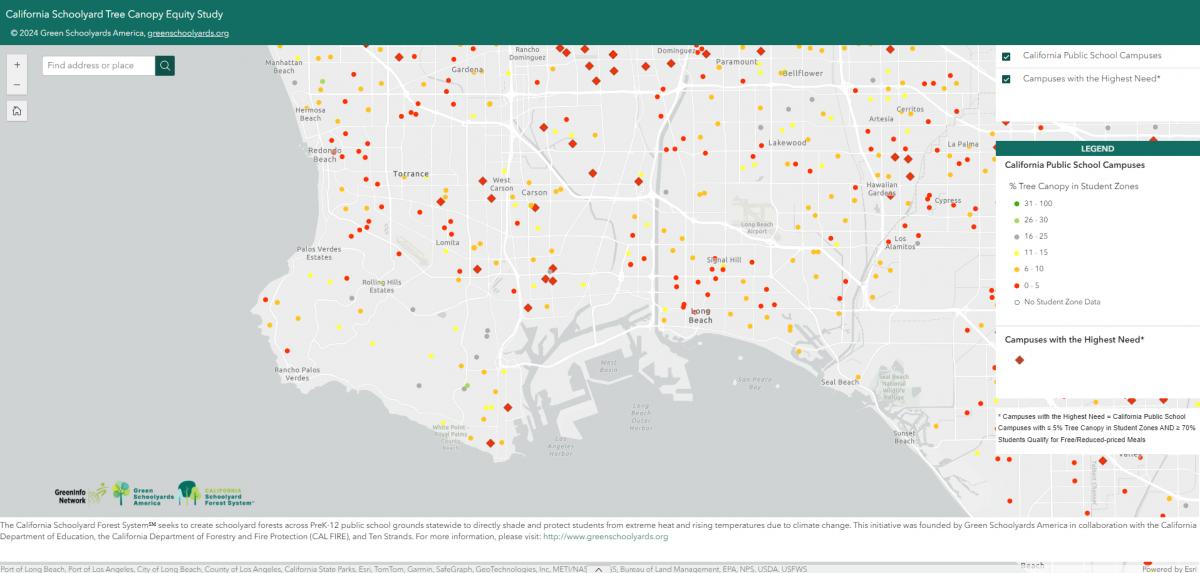
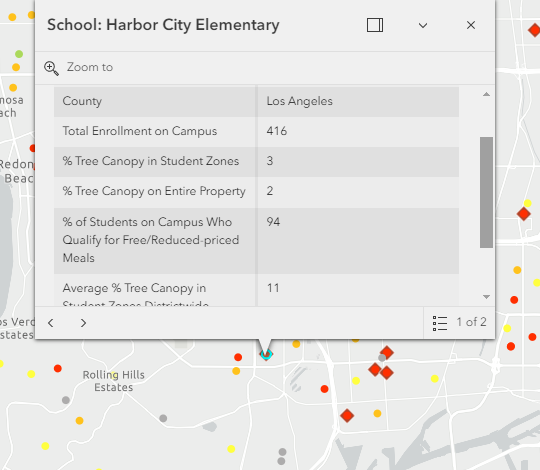
- In 2024, Green Schoolyards America analyzed the data and published their initial research findings alongside an Esri AGOL map that GIN created to highlight the tree canopy metrics from the dataset.
The Work
Process
To have a final California school grounds dataset showing tree canopy coverage in child-accessible areas, the first step was creating a way to collect “child-accessible areas” data, as no such dataset exists.
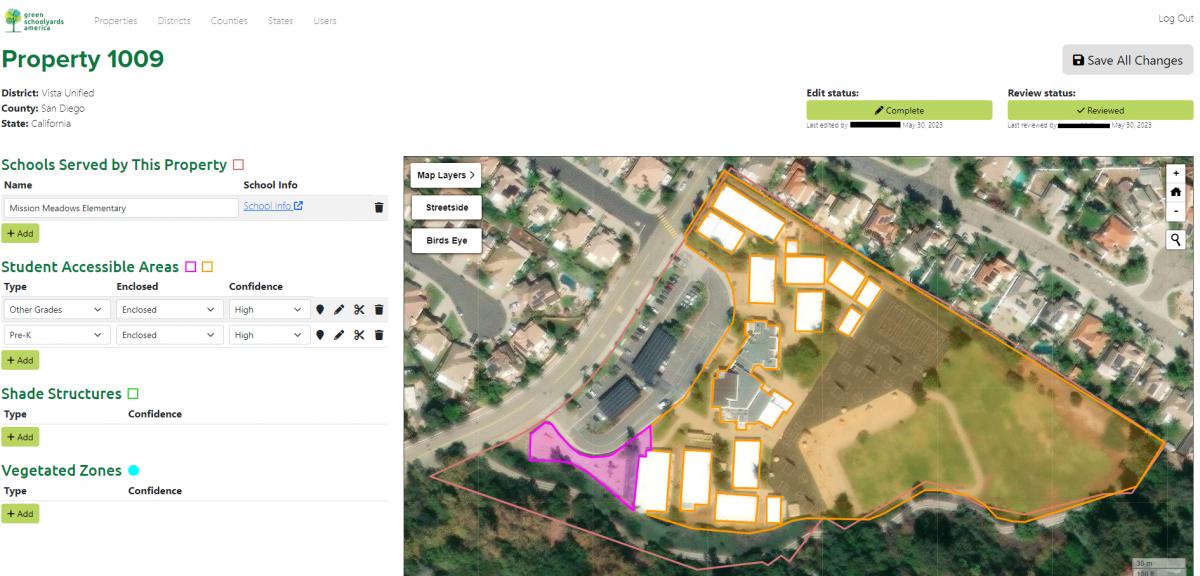
To gather this data, GreenInfo Network designed and developed a web mapping application that supports fenceline-accurate mapping of child-accessible areas on school campuses in California. GIN pulled in school property boundaries from the California School Campus Database into the web interface, and built a web platform that allowed GSA to review each school in California. For each school, GSA used Esri and Bing satellite imagery for reference to trace where child-accessible areas existed within the property.
GIN also built a user interface where GSA could easily assign specific categories to each traced child-accessible area. GIN built a user login and user profile system for the web application, and pulled in user information into a tracking system that supported GSA’s review process. The tracking system Greeninfo built allowed GSA to track who last edited and reviewed the data.
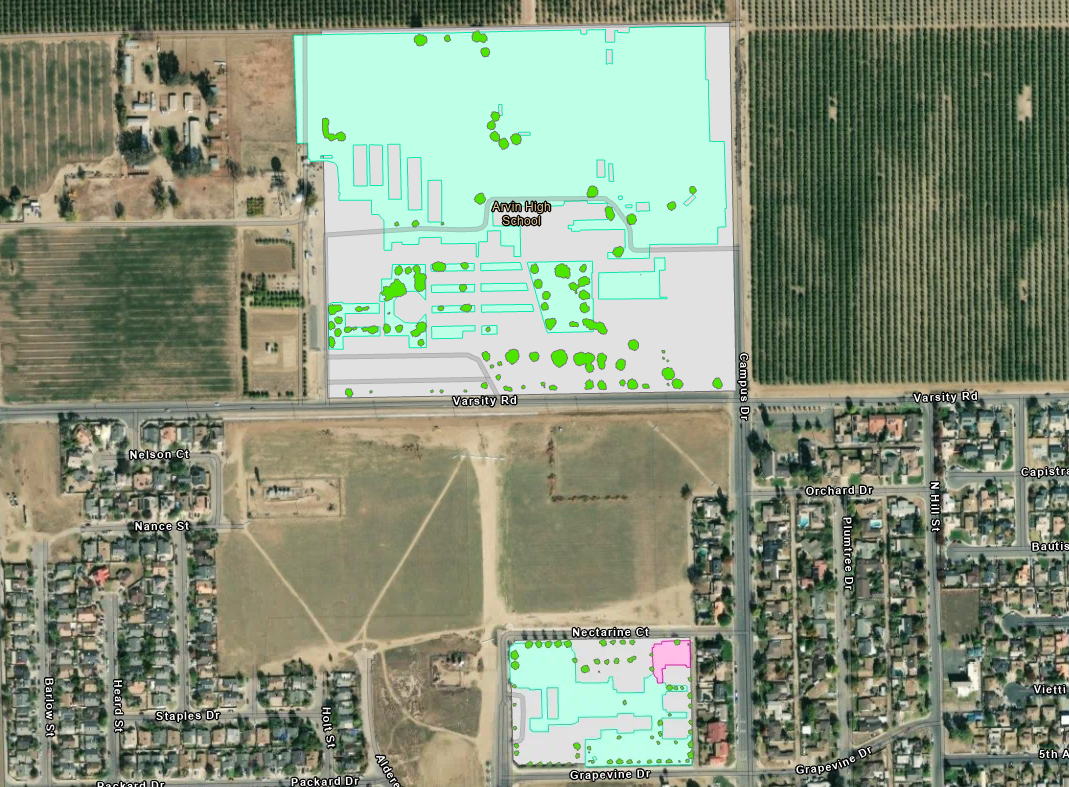
After GSA created the child-accessible areas for all California schools, GIN downloaded and cleaned the data, and then used Earth Define’s high resolution tree data to analyze tree canopy within each property and within each child-accessible area.
GreenInfo Network also collected relevant health, demographic, and student population data (from sources such as CES4, U.S. Census, California Department of Education, and more) and integrated these data into the GSA school database. Adding these data into the final dataset allows GSA to further improve decision-making with the dataset. With such a robust dataset, GSA can review the tree canopy metrics alongside relevant health, demographic, and student population data.
In 2024, Green Schoolyards America analyzed the data and published their initial research findings alongside an Esri AGOL map that GIN created to highlight the tree canopy metrics from the dataset.