A Crowdsourced Zoning Map for the Nation
Land Use Atlas, Inc.
GreenInfo team: Gregor Allensworth, Stephen Smith, Tim Sinnott
Project years: 2022–2025
Overview
What challenges is this project trying to solve?
- The National Zoning Atlas aims to digitize, demystify, and democratize information currently hidden within U.S. zoning codes across the country.
- Zoning regulations are a fundamental part of the communities we all live in, determining where we can live, locate businesses, and more. But this important data is often trapped in PDFs and other hard-access formats.
What were the client’s objectives?
- Based on an existing pilot project, design and build an application to support independent teams in creating zoning maps of their own communities
- Use the data supplied by community teams to populate a national zoning map, freely available for anyone to use.
Results
- As of June 2025, the map covers 50% of the United States by land area across 10 states.
- In total, Zoning Atlas teams have analyzed 76,500+ zoning districts in 7,090+ jurisdictions spelled out in 800,500+ pages of zoning codes!
The Work
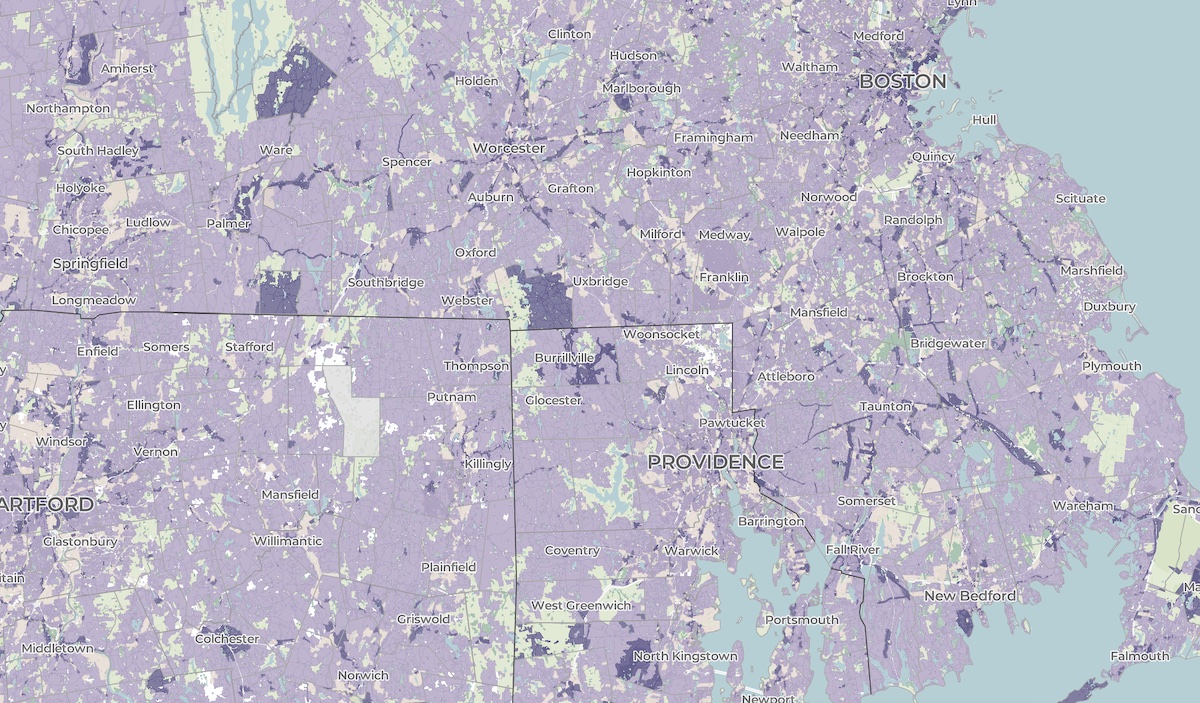
Zoning laws dictate much of what can be built in communities across the United States. But the details of the laws are often locked in lengthy and complicated PDF documents. The National Zoning Atlas crowdsources these influential laws by depicting their key attributes in an online, user-friendly map.
Developing the Editor
In the Fall 2022, the Zoning Atlas was operating within Cornell University. The project’s leaders sought out a vendor to develop a full-stack web application to support the teams of editors who contribute data to the Atlas. The goal was to replace a manual process that used Google Sheets and file sharing services like Dropbox to create a more streamlined system.
The project already had extensive documentation and specifications. Our job was to turn the manual process into a modern web application.
Using an open-source stack built on Azure, we deployed a web server and installed Django as a backend. We deployed an Azure Blob storage to store uploaded files and data, and an Azure Database to host data.
We built a series of pages for viewing, uploading, importing, and editing jurisdictions and zoning districts.
Once the editor was complete, teams of volunteers could start digitizing zoning data in any location in the United States.
Developing the Public Atlas
The Zoning Atlas team soon had enough data to build a public-facing map to display the work of all the crowdsourcing teams. We built a map and search system for navigating zoning districts from nationwide to neighborhood scales.
This work involved both design and technical challenges. We needed to create a search system that was easy to navigate but also flexible enough to work across a wide array of jurisdictions.
Our biggest technical challenge was the compounding complexity of overlay districts. Zoning laws often include stacked layers of districts that don’t align with each other. For example, there might be an area where one neighborhood is zoned residential while another is zoned commercial. But then there’s another shape that partially overlaps both that sets up a historic district. These overlays can stack up, with complex rules for what takes precedence. We worked over many iterations to slice and flatten all the overlays into a single, nonoverlapping layer. That way, in any location, we can clearly state what the zoning laws are. This worked, but it was slow. We then modified the process to increase the speed of calculations by 160X.