PerSquareMile data supports first park needs assessment in Los Angeles since 2009
The OLIN Studio, for the City of Los Angeles
GreenInfo team: Amanda Kochanek, Andrew Nham, Dan Rademacher, Jayita Bhojwani, Maria Lamadrid, Stephanie Ding, Tom Allnutt
Project years: 2025
Overview
What challenges is this project trying to solve?
- When it comes to park access, Los Angeles ranks near the bottom of the nation’s largest 100 cities, according to the Trust for Public Land. The city needs more new parks than it can afford to build.
- In addition to improving its existing parks, the city needs to build new parks, but the city sprawls over more than 500 square miles. It’s hard to know where new parks should be prioritized.
What were the client’s objectives?
- Use data to clearly identify the most important locations for new park development, experimenting with various scenarios to find the balance between feasibility and meeting as much need as possible.
- Provide the priority areas for new parks in a format that could be ranked alongside existing parks in a citywide needs analysis.
- Provide supporting data about potential opportunities within the areas prioritized for new park development
Results
- Out of the 602 one-square-mile grid cells that cover Los Angeles, we identified 36 where new parks or other interventions would help the most park-poor areas of the city.
- Within each of those 36 areas, we identified multiple opportunities on school campuses or existing public parcels that could provide potential park sites.
The Work
Using Data to find where new parks are most needed
This project uses a dataset called PerSquareMile (PSM) to identify where new parks will have the greatest impact.
How PerSquareMile started
The PerSquareMile concept began in 2022 based on a question fro the California Natural Resources Agency. How many new parks would be needed to cut in half the number of Californians living more than half a mile from a park?
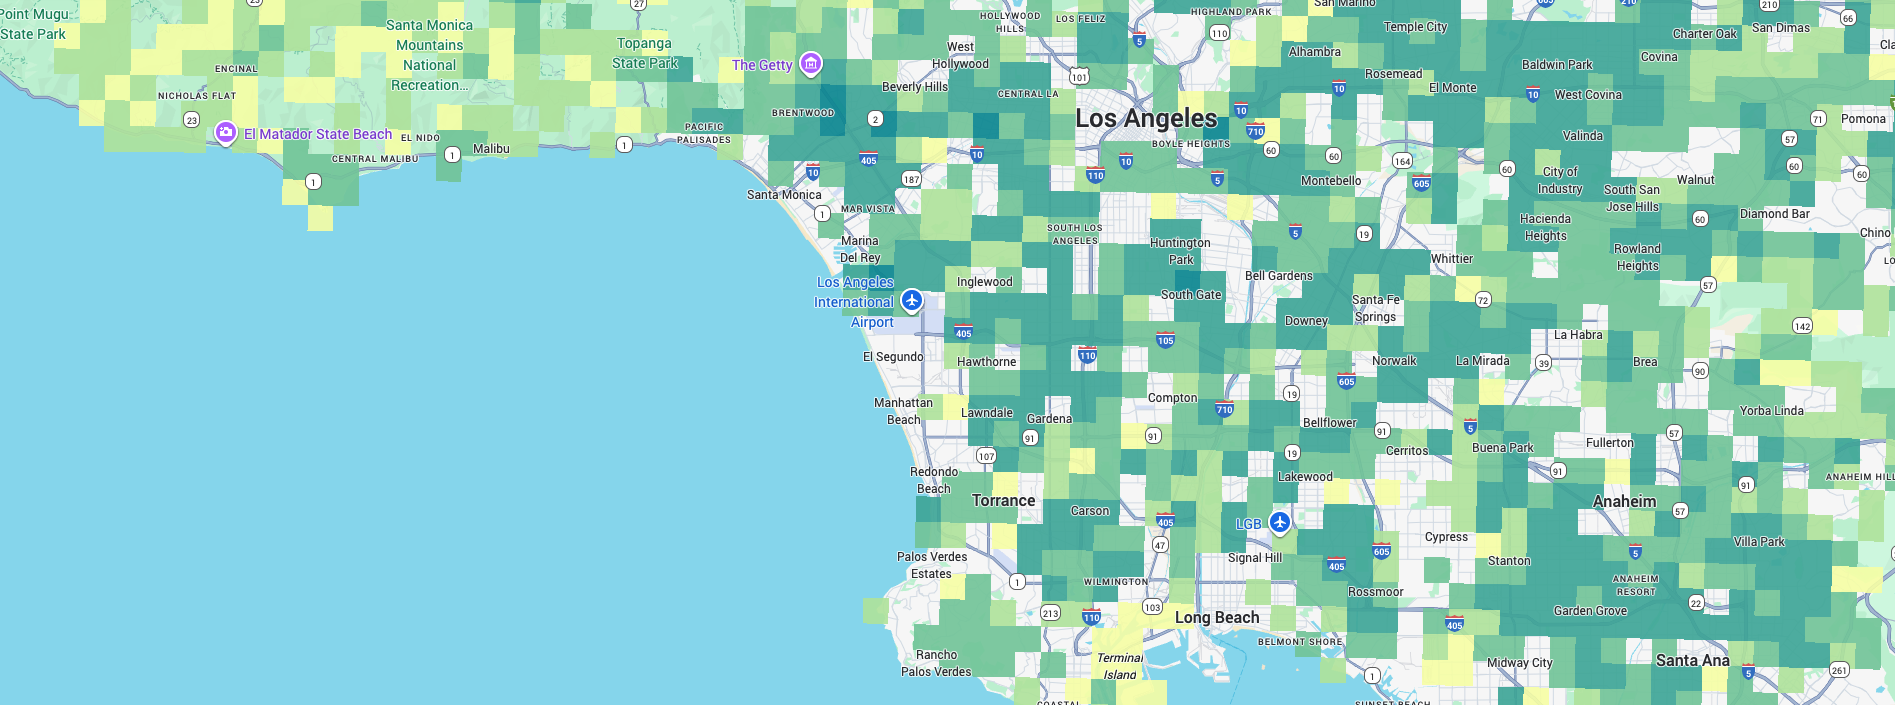
We had already developed high-resolution population data for another project. By organizing this data into a 1-mile grid, we could sort areas by their “no-park population.” Then we’d count how many grid cells would be needed to serve any target number of people. A park placed in the center of each grid cell would serve the people living there.
The Los Angeles Park Needs Assessment
The landscape architecture firm OLIN Studio assembled a “dream team” of consultants: GreenInfo, UCLA, and major LA players like Estolano Advisers, Agency Artifact, and Kounkuey Design Initiative (KDI).
The Los Angeles Park Needs Assessment is the most public and prominent use of the PerSquareMile tool to date.
Using PSM, we identified 36 locations where new parks would most benefit people in park-poor areas.
Testing different scenarios
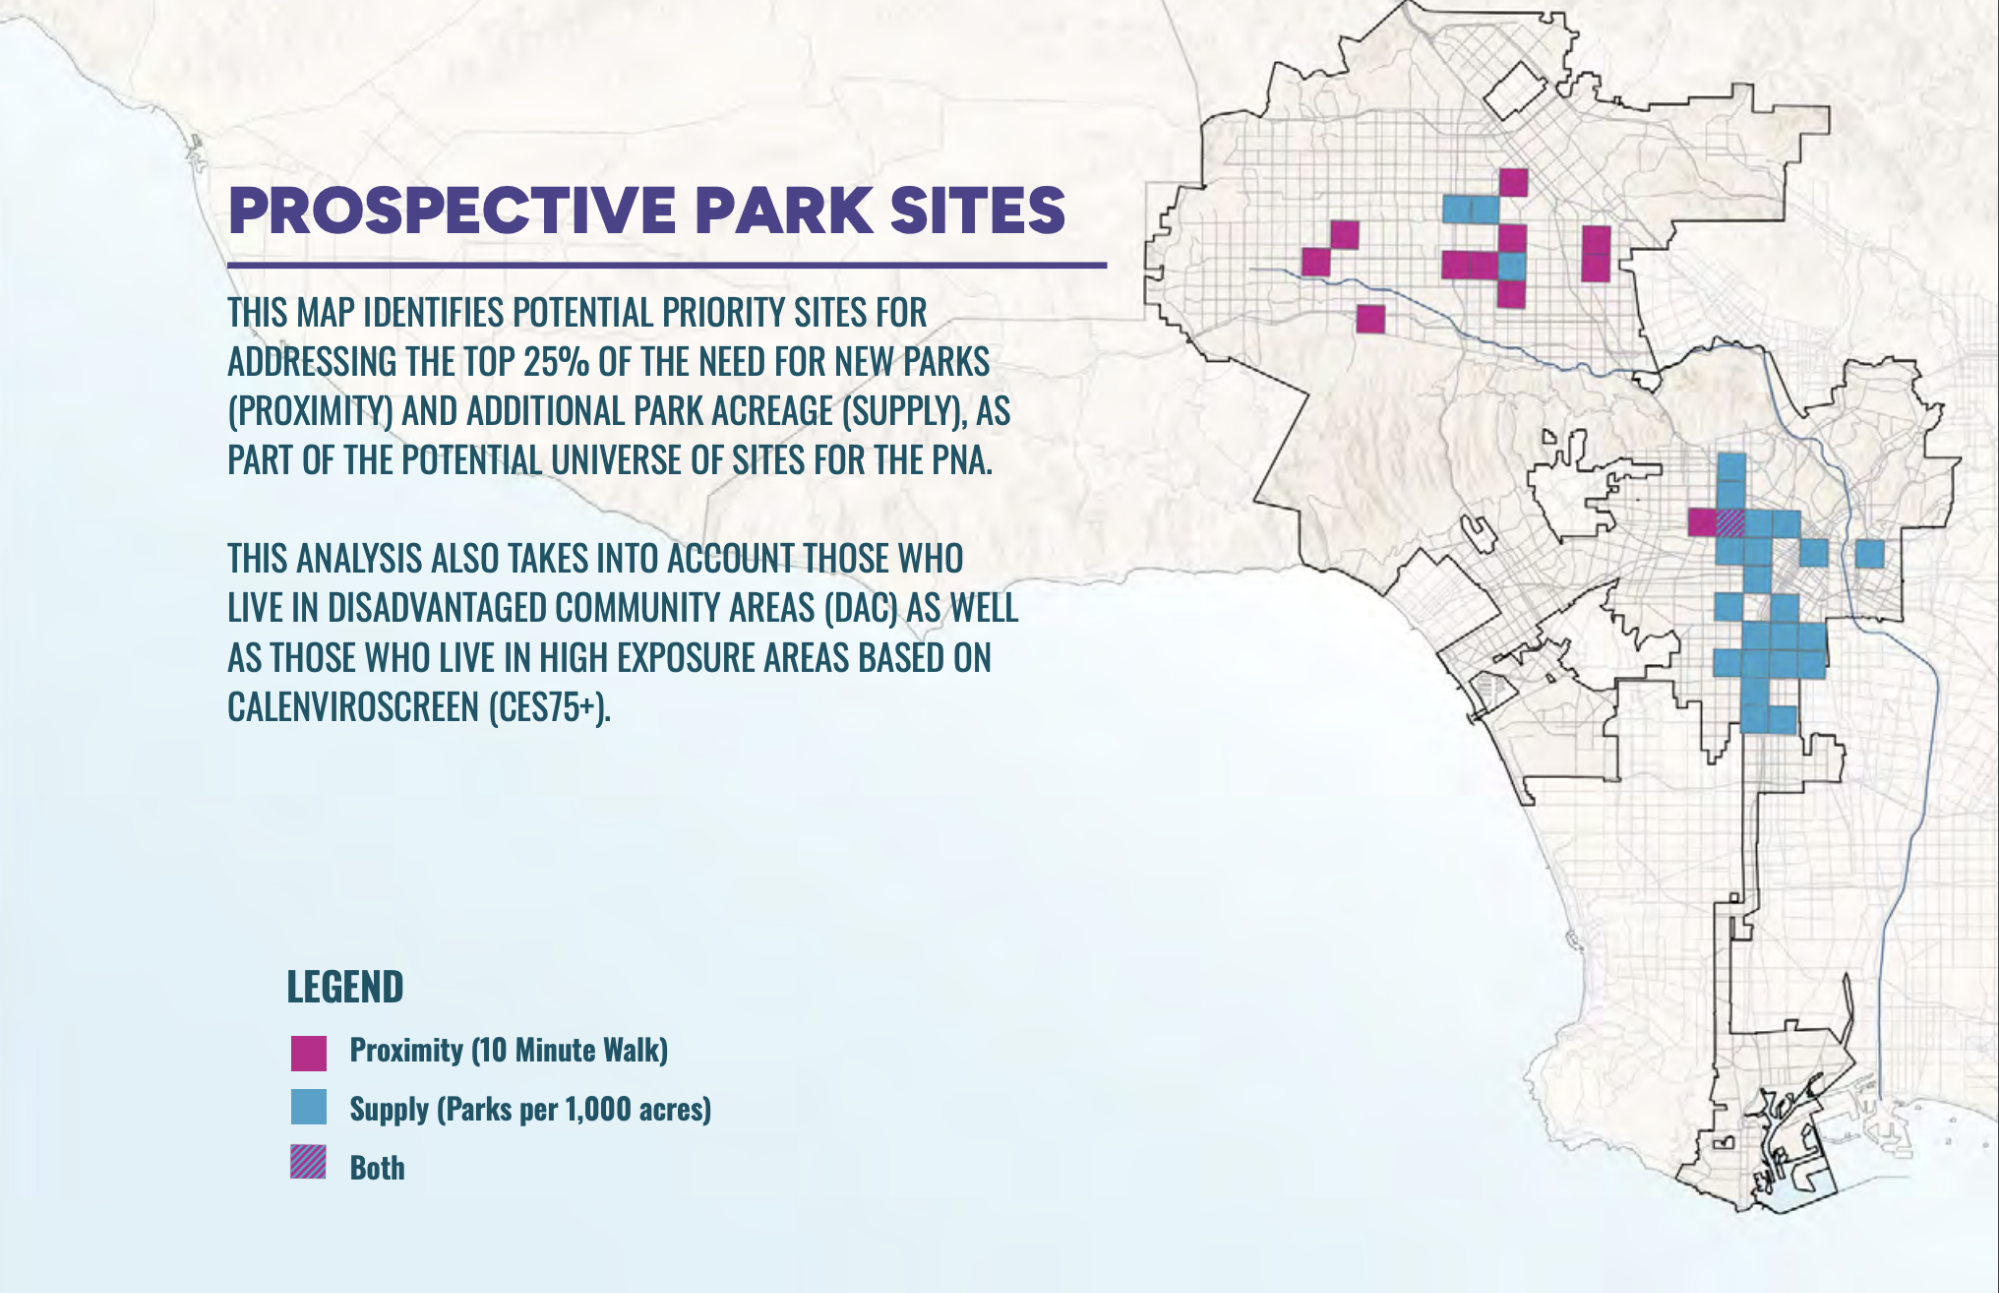
The simplicity of PSM data allowed us to model different scenarios—reducing the number of people who lack parks by various percentages, focusing on low-income areas, or prioritizing areas with high pollution exposure.
The OLIN team presented multiple options to the project steering committee for guidance on which targets to set. Ultimately, they chose a 25% reduction in the number of people in low-income, high-exposure areas who live in park-poor areas.
Selecting priority areas
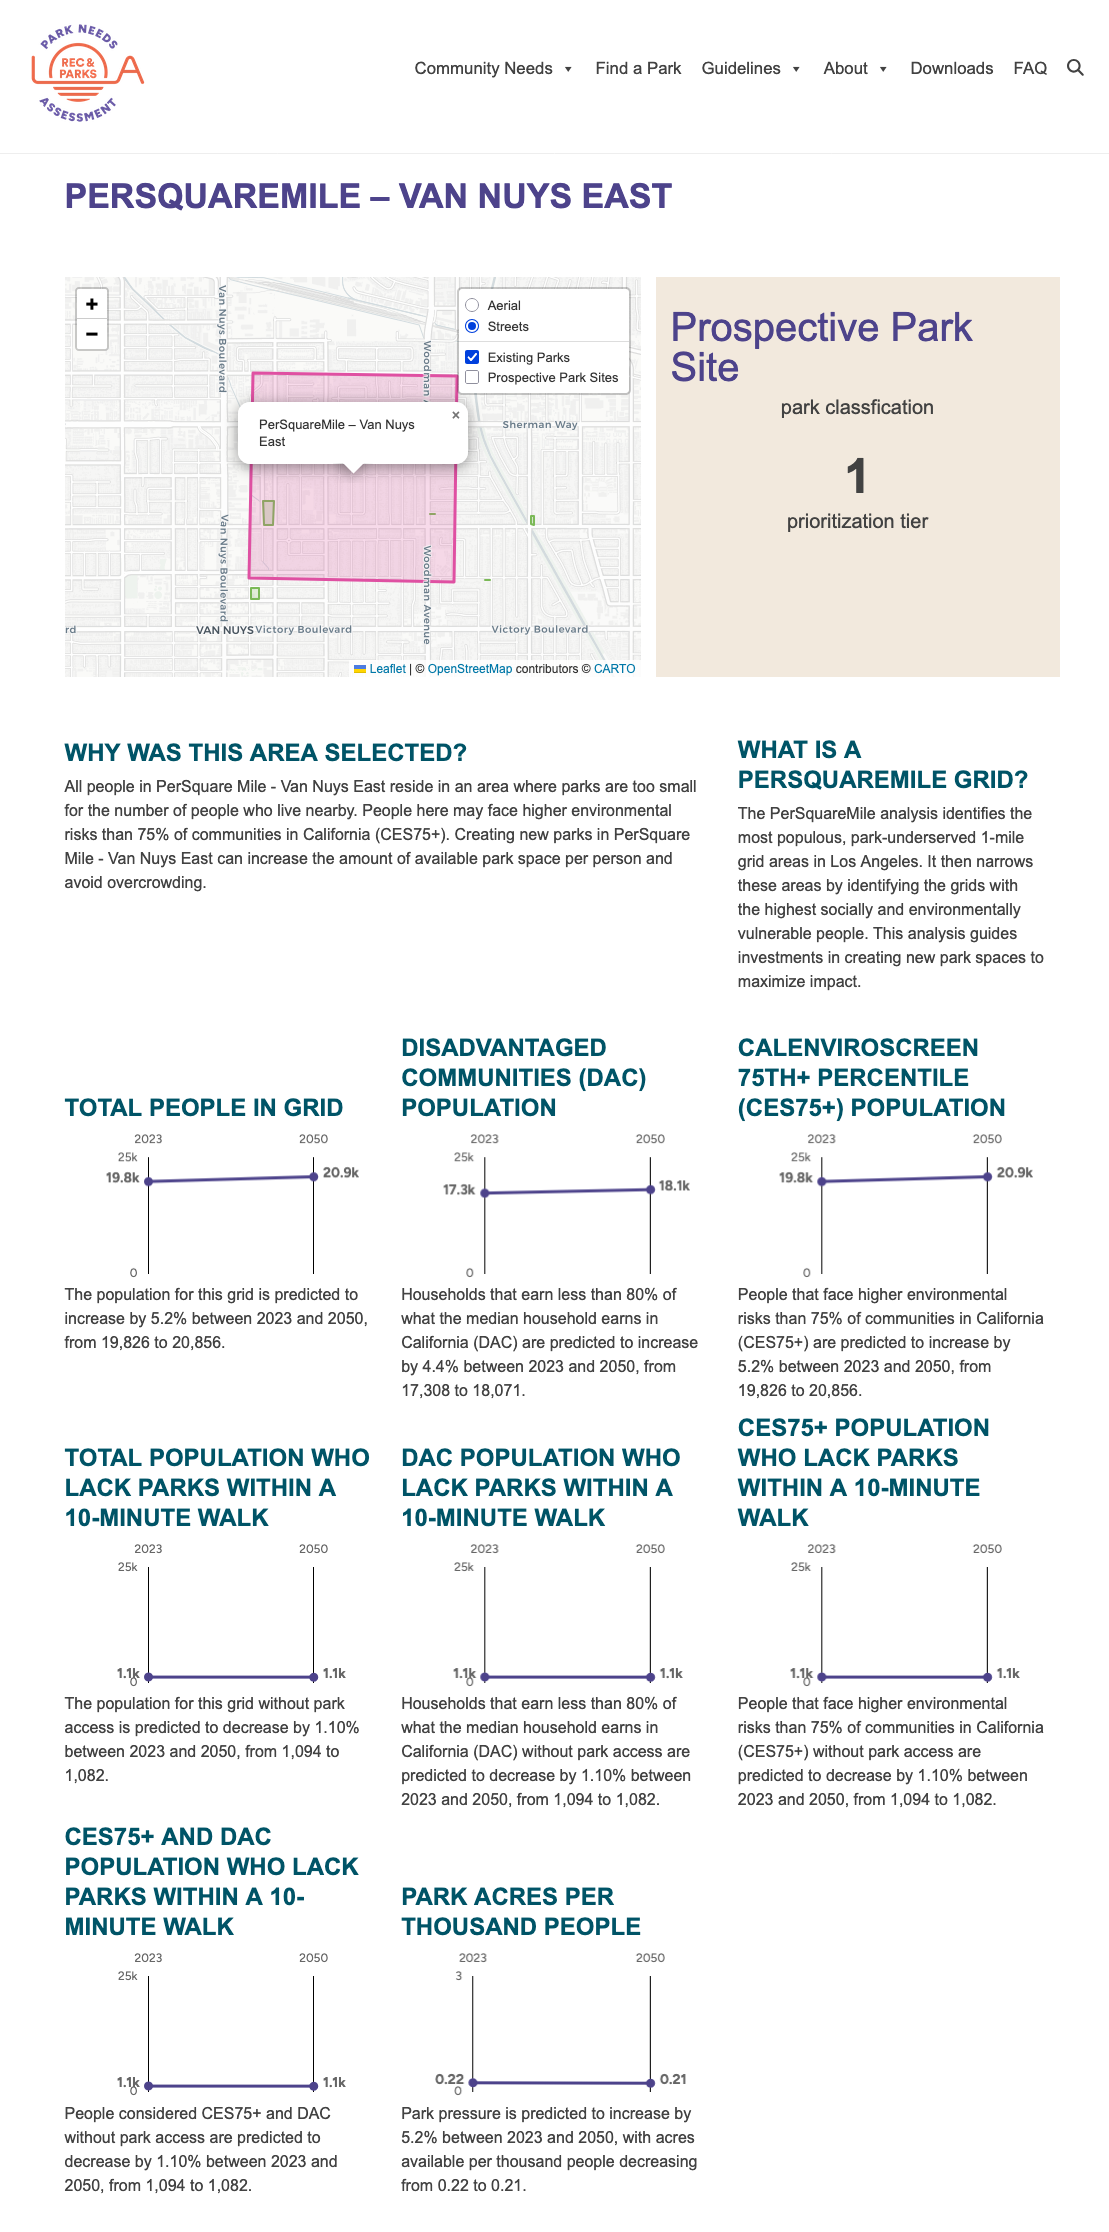
This approach allowed us to select 36 square-mile grid cells out of the 602 cells covering Los Angeles. We then conducted design research to support the presentation of these PSM grid cells on the Park Needs Assessment website. We created tailored text and simple charts to help people understand why we selected each grid cell and how park access in that area may change between now and 2050.
Finding opportunities
Once we identified the 36 priority grid cells, we used our California School Campus Database and commercial parcel data to explore opportunities within those areas. This step revealed that every grid cell had some opportunity to increase park access without expensive land acquisition.
Looking ahead
The Park Needs Assessment will guide park development in Los Angeles for the next decade or more.