Helping transportation planners adapt to sea level rise
Marin County Public Works, Tom Robinson Consulting
GreenInfo team: Dan Rademacher, Gregor Allensworth, Maria Lamadrid, Tim Sinnott
Project years: 2023
Overview
What challenges is this project trying to solve?
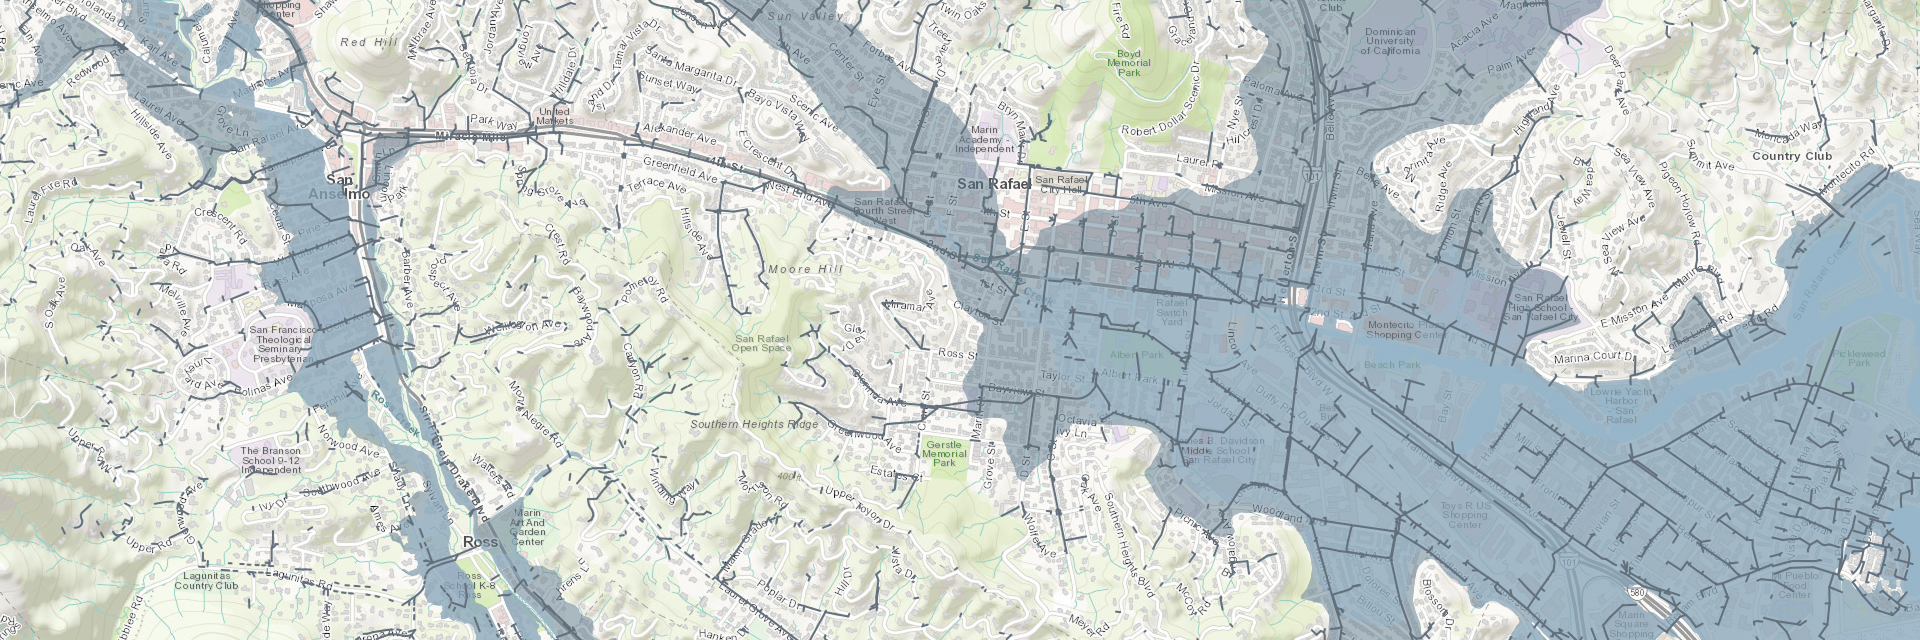
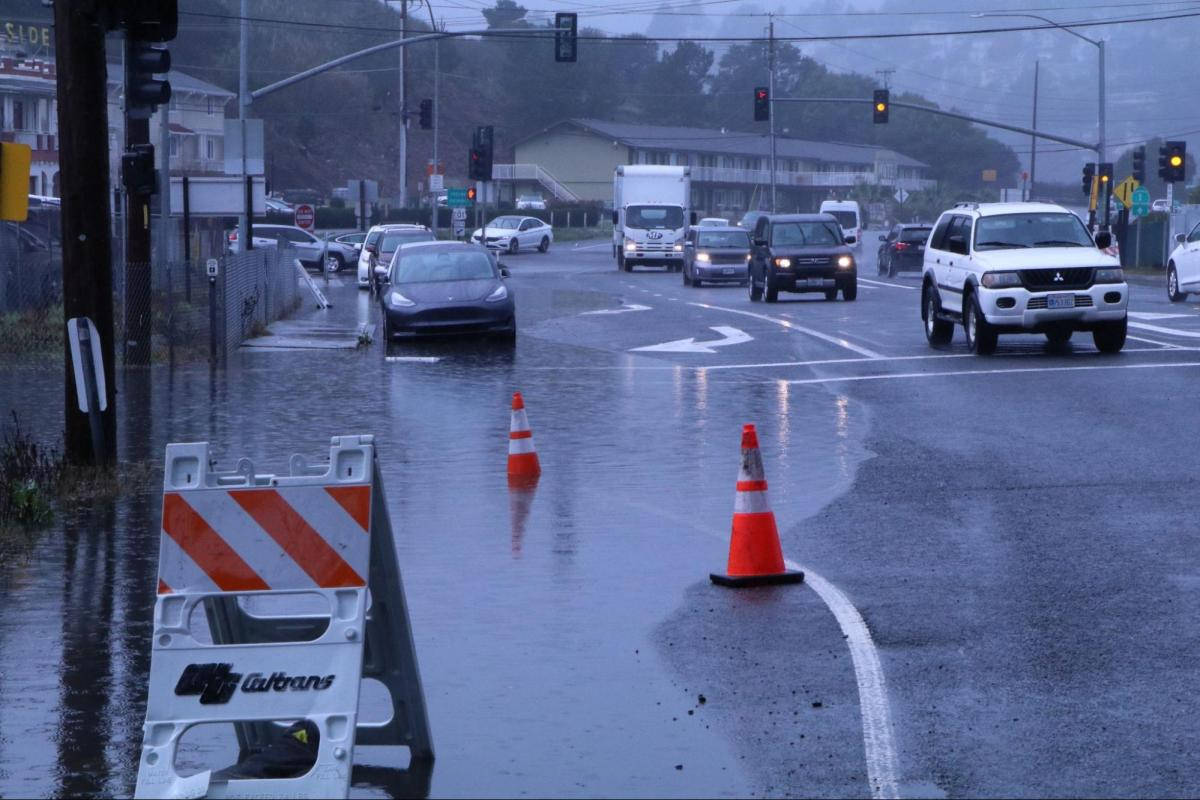
- In Marin County, roads and bridges often run through low-lying areas threatened by sea-level-rise.
- Transportation planners rarely have access to data about sea level rise when they are planning new projects, so the impacts of sea level rise are not typically part of the planning process.
What were the client’s objectives?
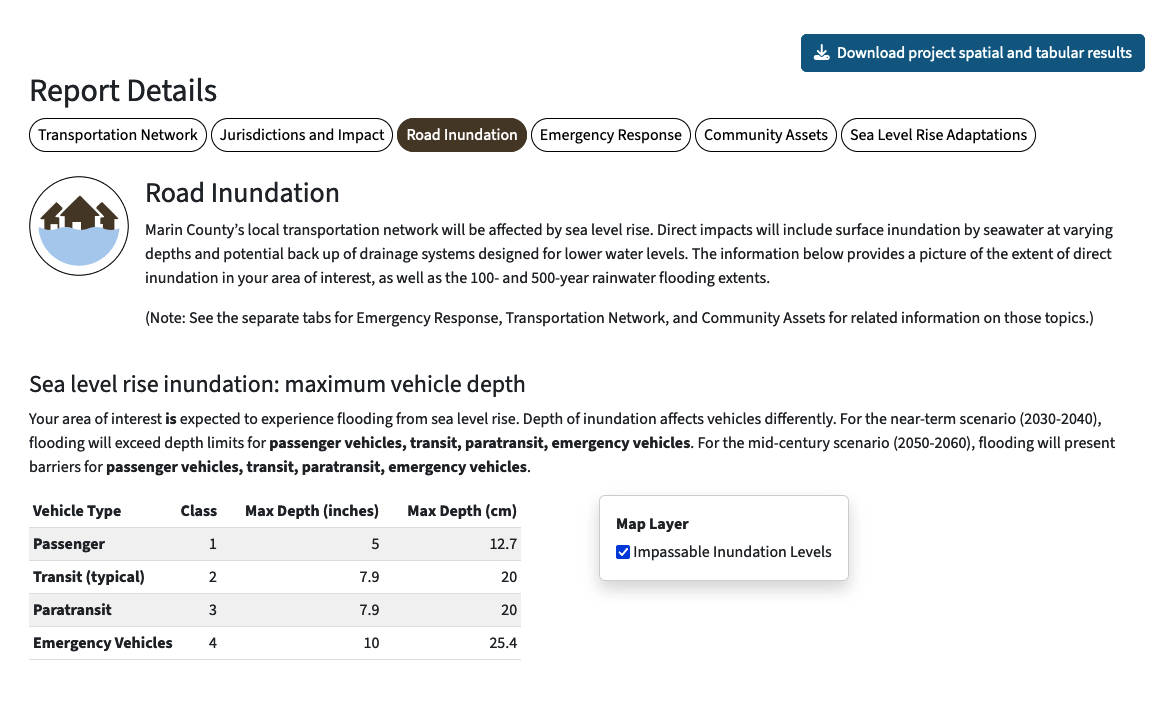
- Create the data that engineers need so they can include sea level rise in their project planning.
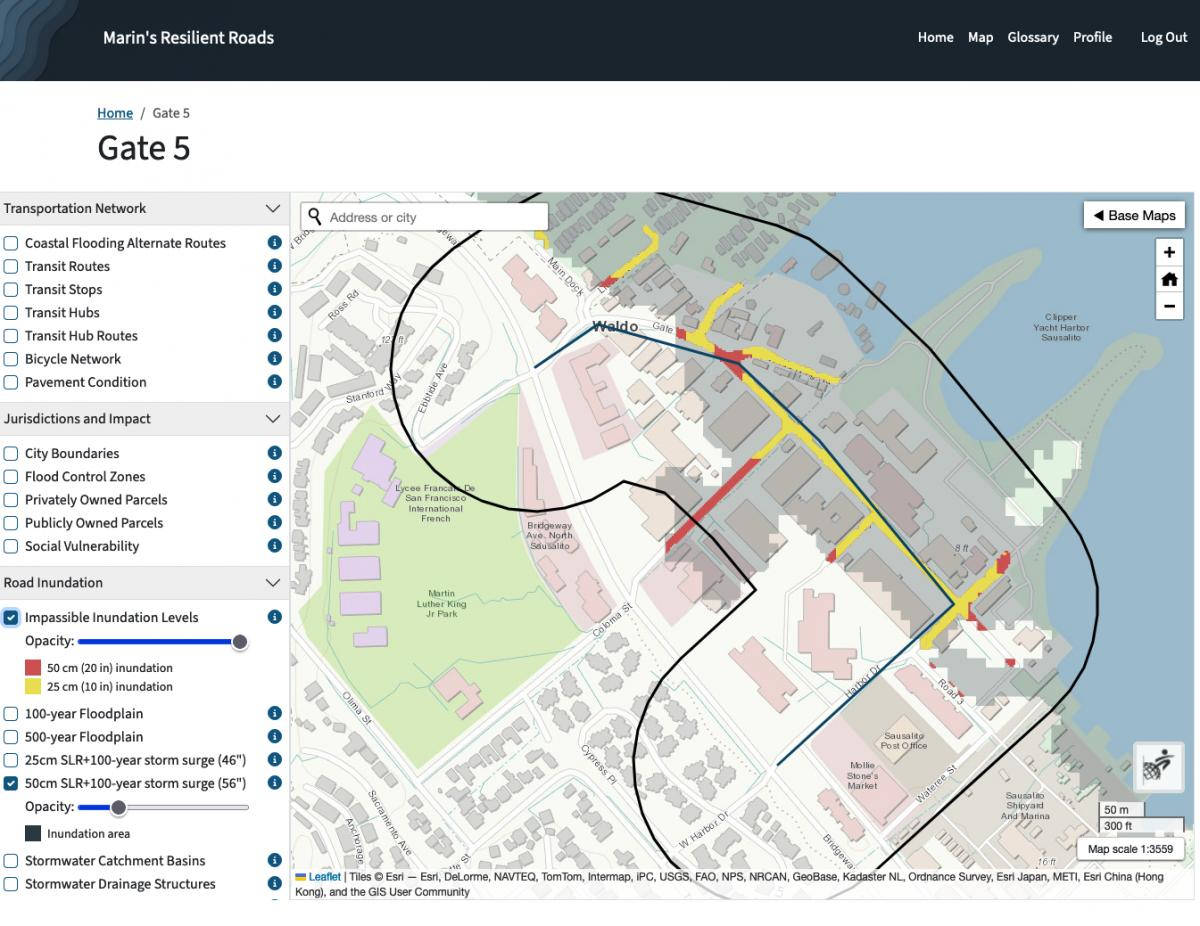
- Design and build a web application for the county and its partners to use in future planning.
Results
- The final application allows traffic planners and engineers in Marin County to consider the impacts of sea level rise when they are planning road improvements such as repaving.
- The tool provides unprecedented visibility for county staff into previously obscure datasets about stormwater infrastructure.
The Work
Design Research
We began the project by engaging directly with potential users. User research is always important, but it was especially so in this case since, as far as the project team knew, no one had attempted to build a tool quite like this one for traffic planners and engineers. We used a survey followed by one-on-one interviews to understand how traffic planners and engineers might use the tool.
At the highest level, our user research suggests that users of the application will want help making the case for action in specific locations more often than they will want help deciding where to act.
We then created a list of data and feature requests that together formed an outline of how the application should take shape.
Visual Design
Working from that outline, we developed visual designs in Figma that showed how users would move through the application, from signing up for an account to browsing the map to creating and saving specific project locations.
During the design process, we also developed a content-rich home page for the application. This helps provide context for users who might not be familiar with sea level rise. Though this application is accessible only to specific users approved by the county, we still needed to allow for a wide range of knowledge about sea level rise, since the topic was new to many in our target audience.
Development
We built the application using the open source Django application framework, backed by an open source spatial database called PostGIS.
We were able to quickly ingest data from Tom Robinson Consulting and build out the full application, including user account requests and approvals, user login and profile management, project creation and editing, and data downloads.