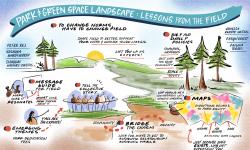
Prevention Institute’s People, Parks, and Power (P3) is the first national funding initiative in the U.S. to support powerbuilding by community-based organizations to reverse deep seated park and green space inequities in Black, Latino, and Indigenous communities across the country. P3 is advancing park and green space equity through this national grantmaking program, peer-to-peer learning community, research, network building, and strategic communications.
Prevention Institute gathered technical assistance providers with different areas of expertise - such as policy and strategic planning; media and communications experts; survey experts; and more - to support the 14 local partners that received P3 grant funding in their project work. GreenInfo Network was brought in for our mapping expertise.
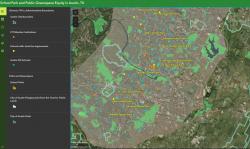
GIN worked with the local partners to produce different maps that each supported the LP’s respective needs for their projects. Given that the local partners were actively working on and changing project goals throughout the two years, it was essential for GIN to regularly meet with partners and sync with their data and audience needs for the final products, as the LPs refined and narrowed down their project scope. GIN also provided mapping workshops, to share information about map creation processes, to support the partners in understanding the framework behind what could be useful to map for their respective projects.
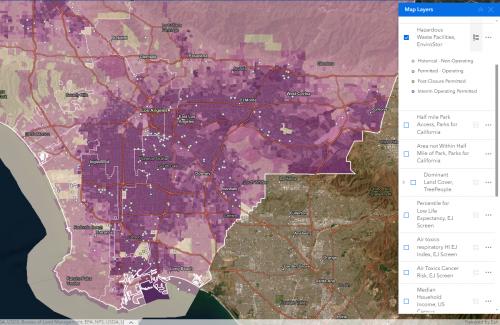
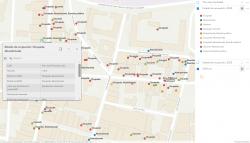
GIN gathered some national-level data -such as U.S. Census and EPA’s Environmental EJ Screen data - that was useful for LPs, and then gathered data that was specific and local to each local partner’s project. We also utilized data that some partners had gathered and created - such as datasets on abandoned and occupied properties; air and soil samples; and more.
A majority of LPs decided to use ESRI AGOL products for their final maps, as the interactive mapping platform allowed each partner to have many data layers in a single place. The ability to toggle data on and off meant that each partner could toggle relevant data layers on and off, depending on the use case and audience. GIN used Instantapp and Experience Builder to provide a clean web interface for the LPs’ maps.
Focus: Social Justice/Equity
Services: Interactive Solutions, GIS Services, Data, Maps, Cartography, Web Mapping
Project Years: 2022, 2023, 2024