New York City is one of many U.S. cities pursuing "Vision Zero," an effort to eventually eliminate pedestrian fatalities due to motor vehicle accidents. And, like many large cities, New York does a reasonable job of publishing public data on critical issues, including pedestrian safety. But making such data available is a lot different from making it truly accessible and useful to the people who need it most. Clinton Hell’s Kitchen Coalition for Pedestrian Safety (CHEKPEDS) wanted to turn the mountain of data about car crashes into meaningful maps and charts that would help advocates push for increased safety in America's largest city.
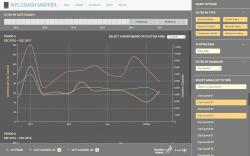
Former GreenInfo web developer Chris Henrick built the map application in early 2017, and then CHEKPEDS engaged GreenInfo to build out an extensive system for charting trends between geographic areas, comparing areas between two periods, and ranking various jurisdictions by the number of injuries and fatalities over the past three years.
Each of these functions is tied to activists' specific needs. The trend charts help isolate whether a particular area is experiencing crashes at a markedly higher or lower rate than other areas. The comparison view helps advocates determine if a particular intervention resulted in a major change in crashes. And the ranking helps put pressure on elected officials or other leaders in locations that are especially dangerous relative to all their peer districts or precincts.
The application relies on extensive use of CARTO.com's cloud-based Postgres database service and API, to which we have extended access thanks to a grant from the company. Currently, Crash Mapper includes data on more than 1 million crashes, and the system pulls in new crashes from NYC's open data portal automatically as they become available.
Focus: Public Health
Services: Interactive Solutions, Applications Development, Web Mapping, Website Design
Tags: urban planning
Project Years: 2017


