See This Project | Similar Projects | All Projects for Client
Water pollution along creeks has big effects on the health of beaches and near-in ocean areas, as well as on the creeks. San Diego Coastkeeper asked GreenInfo to build a map and graph application to show the results of their data gathering on such pollution.
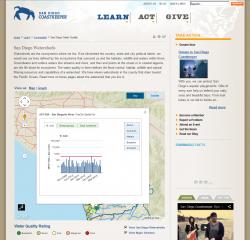
The San Diego Coastkeeper water quality map is built with the Google Maps and Visualization APIs to track water quality at multiple monitoring locations throughout the San Diego and surrounding watersheds. Points on the map are shaded based on their most recent WQI (water quality index) score to provide an overall picture of water quality, and clicking a point opens a popup with options to view dynamic charts of various pollutants measured over time. Users can also visualize two monitoring stations side by side over custom date ranges by choosing the Graph view.
San Diego Coastkeeper updates the monitoring data regularly using a custom interface where they upload station ratings and measurements as exports from their Access database.
Focus: Environment, Public Health
Services: Interactive Solutions, Applications Development, Web Mapping
Tags: California, coast, pollution, San Diego
“ The data portal that Greeninfo created for us has completely changed how we communicate data to the public. The portal is easy to understand, yet conveys a ton of data to the user. The folks at GreenInfo Network were very easy to work with, quickly responding to our changing needs. Their expertise made our vision come to life. ”
— Travis Pritchard, Water Quality Lab Manager, San Diego Coastkeeper
Project Years: 2012-2014


