See This Project | Similar Projects | All Projects for Client
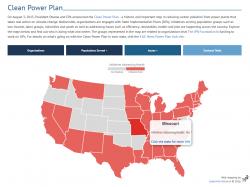
Pushing for clean energy is vital to addressing climate change, and managing economic transformation in the U.S. The JPB Foundation and other funders have supported a broad array of groups to work in states (and nationally) on clean energy program advocacy. They asked GreenInfo to develop a web map application that lets funders, the grantees and others easily see who is doing what.
The spreadsheet was essentially a relational database - grantees had subgrantees, who were active in various states under various grants. Working with the JPB foundation's consultant, we worked out the relationships that needed to be shown and set up the spreadsheet in a web database that could manage the visualizations.
We also designed a mapping interface that built on another, similar project. By allowing users to choose categories of views on top of the map, or click on a state directly, they could visualize the overall pattern of groups and funding - and topics - very quickly.
Technically, this is a simple and very adaptable map that uses the D3 JavaScript library for rendering and interaction. We back that with some data-processing scripts that take source geography files in TopoJSON format and cross them with CSV data (like those saved out of Excel) to generate a composite JSON file that drives the map. This map could be quickly adapted to show other categories of data and other geometries (counties within a particular state, for example).
Focus: Environment, Philanthropy
Services: Interactive Solutions, Applications Development, Web Mapping
Tags: energy, united states
Project Years: 2016


