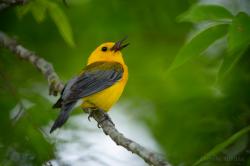
Colombia has about 20% of the world’s total avian species, making Colombia home to the highest bird diversity on Earth. The country’s habitats are home to more than 200 migratory species, making it imperative for conservation practitioners to determine where to focus their efforts to provide the greatest benefits. With this in mind, the National Audubon Society – in partnership with BirdLife International, Calidris, Humboldt Institute, and NASA Goddard Space Flight Center – reached out to GreenInfo Network to build a Spanish-first geospatial tool – Alas Seguras – that would support making such decisions with data and maps.
User Research
To ensure Alas Seguras was as useful as possible to users, we began the project with user research. Our user research played a crucial role in uncovering the best uses for the tool by deeply understanding the needs and motivations of the users. We conducted a self-reflection exercise with Audubon's oversight team to help them articulate their goals and the metrics they use to measure success. This exercise was instrumental in identifying the specific questions users needed to answer and the initiatives they were pursuing to achieve their desired outcomes. Through this research, we discovered that users are not merely looking to view data; rather, they seek to leverage the tool to drive impactful decisions by answering key questions that guide their actions. By focusing on these user-defined case uses, we ensured that the tool was tailored to support meaningful decision-making processes.
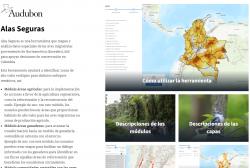
The user-defined case uses are: Agricultural Areas, Livestock Areas, Bird-Friendly Communities, and Protected Areas. Learn more about these areas here (
in Spanish).
Data, Prep, and Infrastructure
We worked with Audubon to pull in the appropriate vector and raster data, in addition to preparing and formatting the data at the appropriate resolution, and building automated scripts as needed to create data pipelines. Data layers are hosted in Audubon's Enterprise Portal, and ArcServer Image Services allowed us to process raster analyses on-the-fly.
Based on specific identified user needs, raster data layers were analyzed and combined into Weighted Raster Overlays, providing an output raster with values that could be used to solve multicriteria problems such as site selection and suitability models.
Tool Build
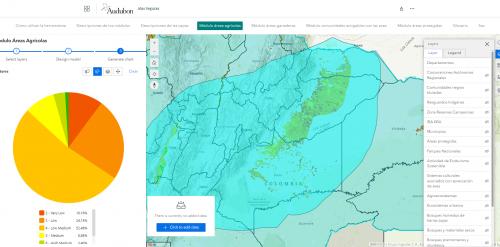
We needed a flexible, detailed, and user-friendly tool to provide this data-driven support for Colombian decision-makers and bird advocates to achieve these goals. To this end, we turned to Esri's Experience Builder to create a platform for configuring the final application. Incorporating Experience Builder’s new Suitability Modeler widget, a powerful analytical tool, allows users to evaluate multiple factors simultaneously by combining and weighing different data layers. Users can combine and weigh different data layers that are important, prioritize or deprioritize attributes based on their analysis needs, and produce a single raster output onto a map that highlights a meaningful outcome to support their decision-making.
For example, to answer the question “Where can surface water sources work as natural corridors along an agricultural landscape through riparian vegetation?” , a user can select three data layers 1) Surface water, 2) Land Use: Agriculture, and 3) Bird Friendliness: Wetland, and prioritize any attributes within these data layers as needed.
The output raster would show weighted/ranked areas on the map, based on the prioritization choices. We also incorporated relevant geospatial boundaries and administrative units into the map so that the user can analyze the output raster alongside areas relevant to their needs.
We built a module for each user-defined use case, as each use case required different datasets to support appropriate analyses. The modules are easily linked and accessible in one space using Esri’s StoryMap Collection. Using content from Audubon’s team, we also created pages describing the modules and how to use them; a glossary page; a partners page; and an acknowledgements page.