See This Project | Similar Projects | All Projects for Client
States that use federal funding for parks have to do comprehensive plans every five years to define what needs they're meeting and how they intend to do that. California took an innovative approach to its plan and asked GreenInfo to develop data, analysis, tools and a report and associated web site to make that approach work.
OGALS approached GreenInfo early in the SCORP process and laid out two approaches - building the SCORP around the needs of all Californians for local parks (SCORPs often focus heavily on just state parks), and developing an evocative SCORP report document to make the case for park needs in the state, complemented with a full web site offering tools and other information (learn more about the web site project » ).
PARK NEEDS: Because CPAD data is highly accurate and complete, showing almost all of the state's 14,000 parks, OGALS could assess with confidence the degree to which Californians were being served by parks, particularly those in neighborhoods. GreenInfo worked with OGALS to refine CPAD data and to apply it to an analysis of whether parks existed within a half mile of residents, and the degree to which local areas had at least three acres of parkland per 1,000 population. This work drew on GreenInfo's extensive background with this type of analysis - see more about what we can do » The park needs analysis was then developed into an online tool in the Parks for California website.
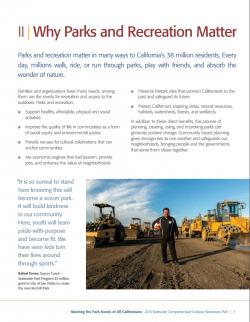
SCORP REPORT: The task of designing the SCORP report started with close consultation with OGALS staff on objectives and audiences. Our basic strategy was to develop a report that was strong on information, but was compelling in terms of using visual design to guide a reader through that information. GreenInfo reviewed past SCORPs for California and other states, and used OGAL's working draft material to develop a framework outline of what the report could be. At the same time, OGALS worked this outlining back to leadership at State Parks to get general agreement on message and "story".
The development of the "story" was key - an overall message was defined around focusing on the parks managed by the 1,000 related agencies in the state in relation to the state's 38 million residents, informed by the GIS analysis of the parks data, which showed a stunning figure: one quarter of the people in California don't have a park within a half mile. This also balanced by noting how much progress has been made in creating a network of 14,000 parks in the state, over 150 years.
The report was structured around this sequence of story telling: what has been accomplished, why parks matter, the analysis of need, strategies for improving existing parks and success stories, review of parks funding in California, and finally, an action plan.
The design of the report was started at the same time as writing began - GreenInfo strongly believes that design and writing of these types of documents are parallel processes. Early mockups just allocated initial content to a set number of pages (28 at the start), so that we could determine what needed text, graphics, photos, strong headers and other treatment. Our longtime design partner, Ison Design, then began developing the visual styling for the report and we slowly started constructing the full report - at first the document was "fuzzy" (outlines, placeholders), then successive drafts brought the actual report into sharper focus, which allowed us to track the overall impact the design was having. Over six months there were extensive reviews within state government (including the Governor's approval) and many revisions - in all, 30 revisions of the report were created, to be sure we got things right. GreenInfo staff collaborated with OGALS on writing and developed illustrations and other graphics in the report, with our designer.
One element in the report was showing the GIS analysis of park needs - GreenInfo searched for the right visualization and color mix for distance from parks and parks per thousand images (see illustration of options).
The final SCORP was published in July, 2015. The report stands at 32 pages and is carefully designed to allow casual browsing of key messages in each chapter, with the visualizations slowing drawing in readers to the more detailed content. One key part of the report process was commissioning a state parks photographer to go with OGALS staff to funded park sites and create powerful portraits of the people involved - these photos put eyes on the reader and bring them closer to the content of the document.
Download a PDF of the SCORP »
Focus: Environment, Government Agencies, Public Health, Recreation, Social Justice/Equity
Services: Communications, Graphic Design, Strategy, Publications
Tags: California, parks, recreation, SCORP
Project Years: 2014-15


